Have any questions?
+44 1234 567 890


for fleet owner
A fleet owner takes advantage of the logs in various ways.
First the new accuracy by the second delivers approximately 3€ more billing per flight on single mot planes. This is because there is no seconds roundup at the beginning and no cut off at the end by the pilot. About a dozen flights per month pay back for the whole monthly service charges. Next you may submit data automatically to your maintenance.
They will be informed about hard landings or engine overstressing instantly in real time. Think about how much hard landings or cold takeoffs can cost you later on. Futhermore a lot of airfields have only short opening hours because of their operating cost. However this limits your flying slots and turnover. How would your business grow if you could fly SR-SS also under unstaffed tower conditions? Legally this becomes possible, talk to your airfield. We have download utilities for tower logs running already at our home base in EDRT.
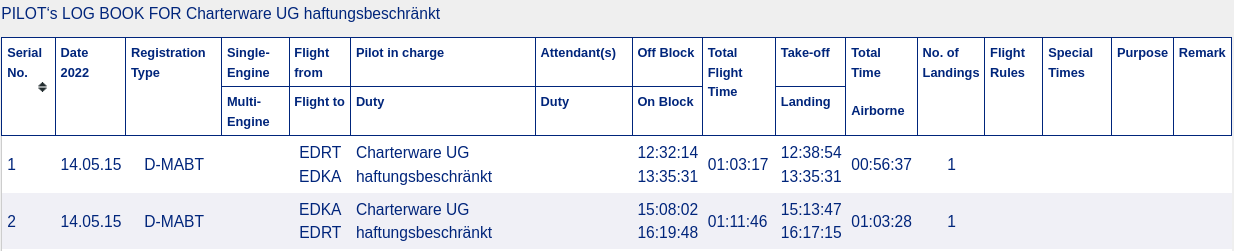
Automatic logs for pilots, planes, students and maintenances with the Flight-Log package
sample of pilot book
Tracking by googleearth
On your right hand side you see a little video about a track replay. It will soon contain not only postion tracks, but even roll, pitch- and yaw- angles giving a realistic horizon replay, just the way you look at the environment when flying. Hit the replay button to takeoff in EDRT.
as a google earth flight
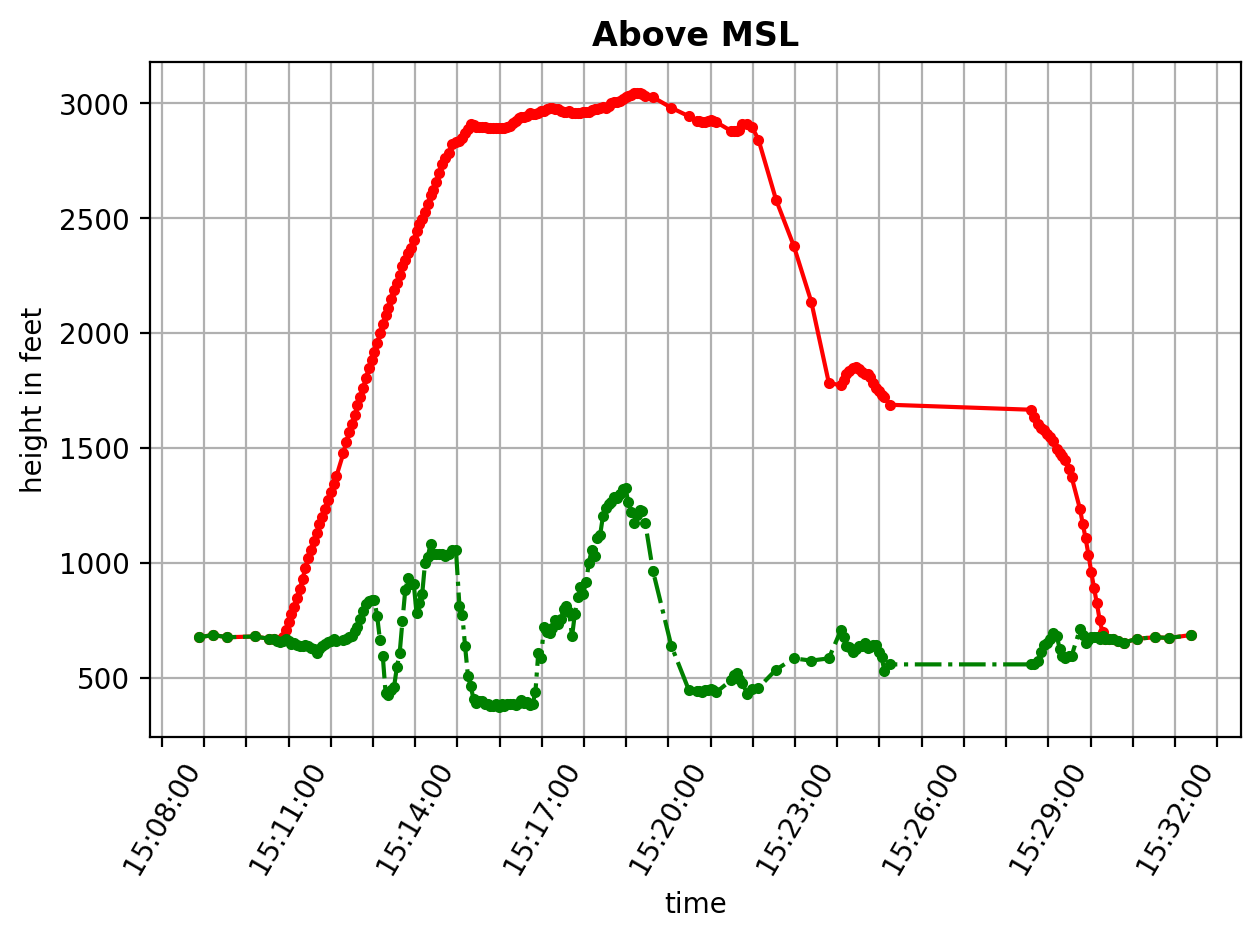
Altitude visualization of your flight
It contains both, the MSL altidute of the ground as a green graph, and the red graph shows your track altitude above MSL.
as a png file
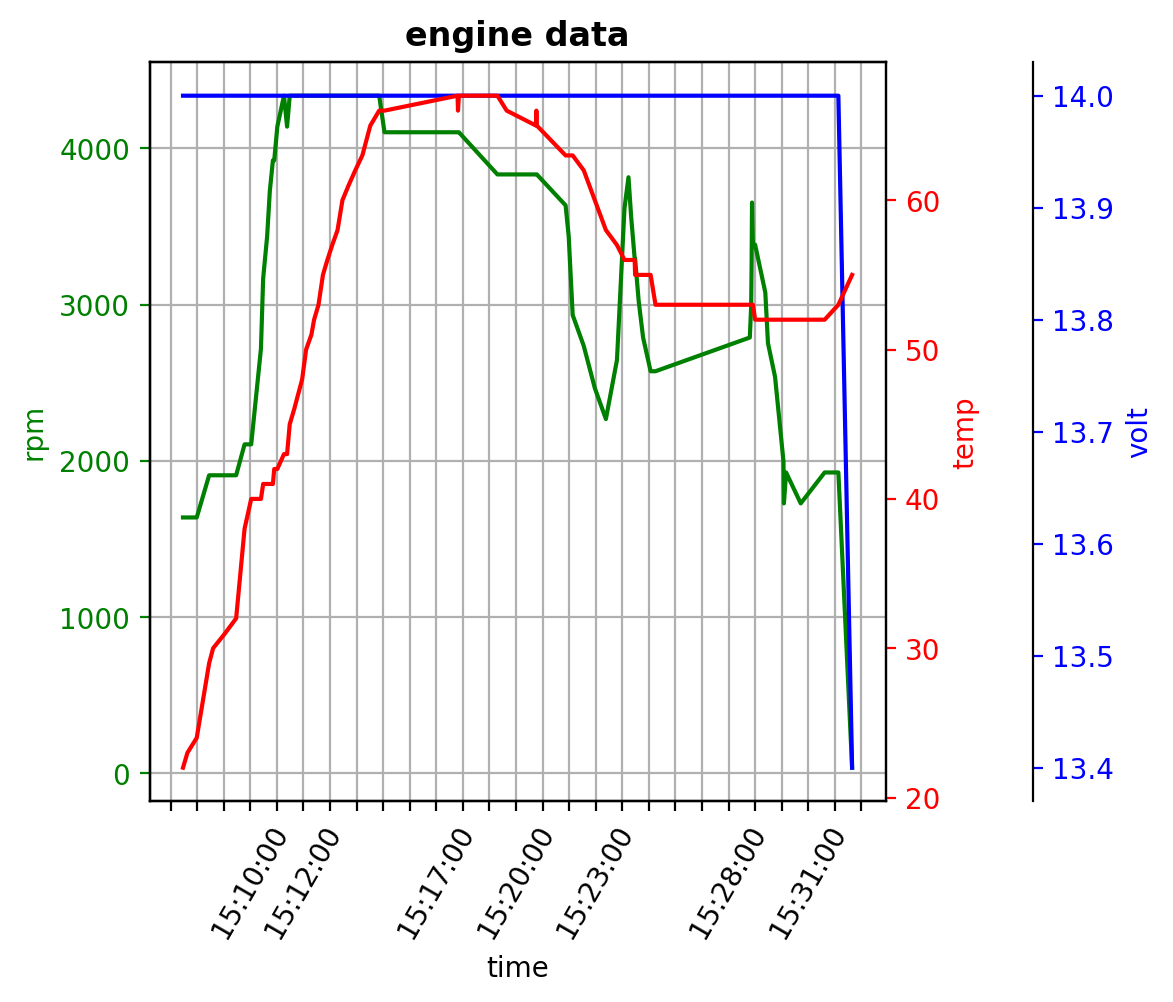
Visualisation of engine parameters with package "tech-log"
Engine data Log
You see 3 parameters over time, rpm , volt and temperature.
Lets look at them moore deeply. The blue volt log starts from 12,25V after the engine was off for a significant time. Then very early the engine was started and now the generator increases bord net voltage up to 14 V during the whole engine on period. You would be able to see if your generator has a problem, by no increased or dropping voltage during engine on. At the end of the flight when the engine is turned off, the voltage declines slowly and reaches 13.4V at the time of MainOff.
The green graph shows you the turn rate. You can see at the beginning a tableau of 1800 rotations which is typical for an ROTAX 912 with minimum power setting. Meanwhile the red temperature graph raises from 22 °C til 45 °C rather rapidly as there is not much cooling standing on the ground. At this point when 45° are reached the plane begun its start run which you can see by the turn rate raising to 4500rpm. The temperature then continues to raise less fast because of the intensive cooling by the propeller and flight speed. It reaches it's maximum of 70 °C after 10 minutes. During landing approach it cools down towards 55°C because of less power setting in a combination with high cooling because of approaching speed. If you look at the end you see the temperature slightly raising again. This is when the plane reached its parking position, the engine is still running, but there is less cooling. All those informations let you and your maintenance monitor the engine and cooling system healthyness.
as a png file
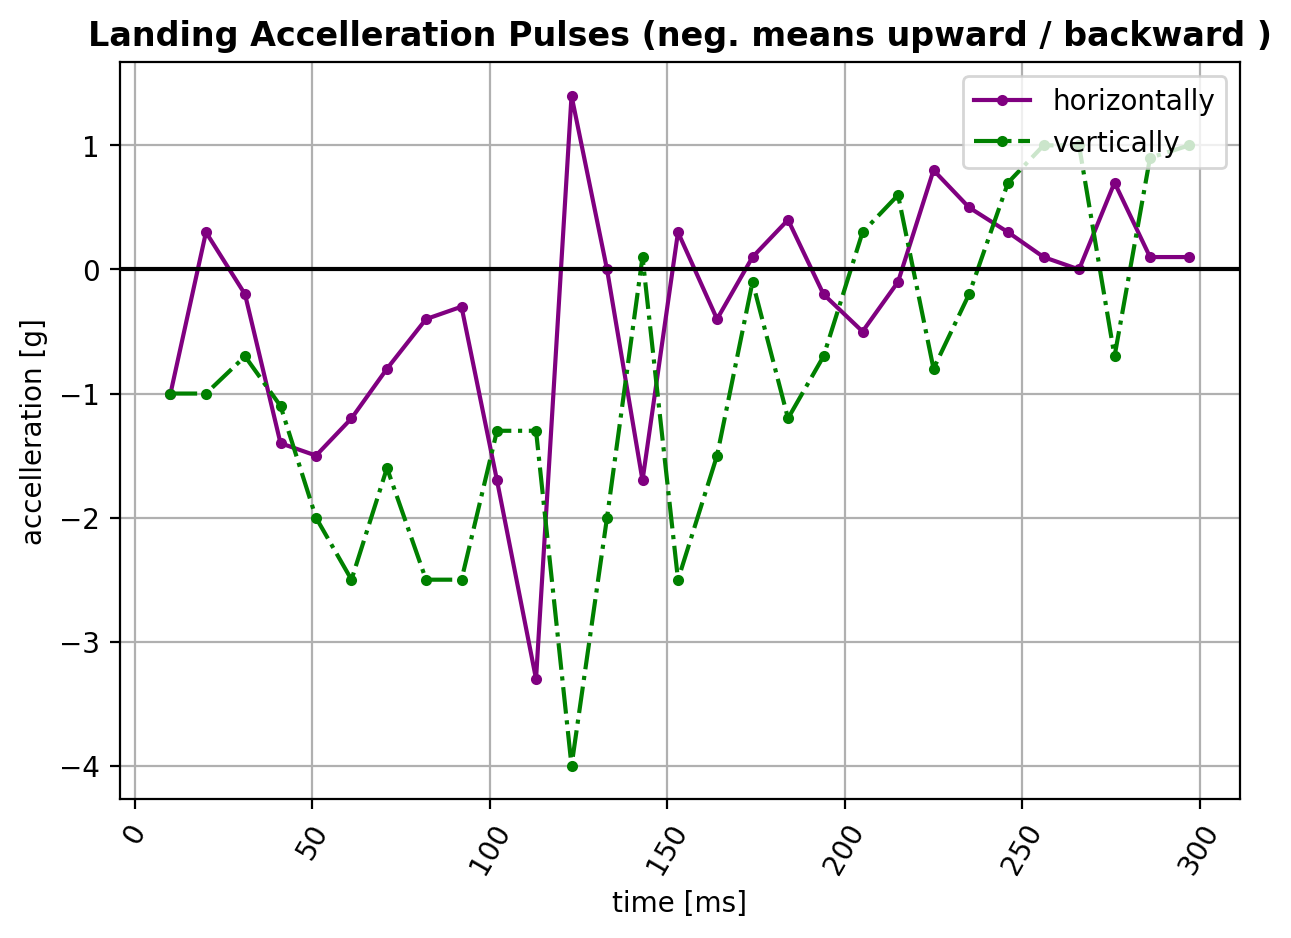
Accelleration graph
You can next see a 3d snap shot of a harder landing. To make the graph less complex we have just visualized longitude and vertical accelerations which take most of the energy of a landing bump. We will soon come up with graphs how the plane rotated during a hard landing, that will give you information about front wheel landings as well. We hope to come to a relyable statement about such incidents.
You want to go for a better understanding of the graph ? Here is how:
The green graph represents the acceleration vertically which takes the majority of the bump.
Positive is the direction "acceleration to earth", negative is up into the air. The latter is our direction of an hard landing bump as we are getting pushed back upwards during a hard landing to reduce falling speed to zero or even push us back upwards.
So consequently the first 200ms of our green graph before it turns positive represents our bump, all the rest is sweeping out. In a very rough estimation we have averagely 2g negative during the first 200ms.
That gives us a difference in Speed = 2g*200ms = 20m/(s*s) *200ms = 4m / s = 14 km/h. Our plane actually lost as much energy as is contained in a slow down of 14,4km/h which is 9mph.
You could also express that as an equivelent of dropping altitude by expressing it as potential rather than a speed energy. To find out you would set equal
Energy = m*v*v/2 == m*g*altitude. Reordering the formula gives us
Altitude = v*v/2g .
Putting numbers in results in
Altitude = (4*4 m*m*2) /(2*10m s *s) = 0,8m.
We can roughly estimate the energy contained in the blue horizontal graph, which follows the same formula to 30% i.e. 0,25m and the hidden transversal vectors will be good for annother 0,05m so we are in total talking about a dropping altitude of more than 1m or 3 ft. You can imagine that is a pretty hard landing.
And it was, the graph is a real one of an incident in Bavaria Germany, - the landing gear was hiddenly damaged, but detected by the fleet owner supported by charterware.
as a png file

Finally we all know about telematic discounts by car insurances. The reason why they are not available for aviation so far is because no telematic data were available to insurances. This has changed know. You may share necessary data about your flying style and usage profile with your insurance and archieve a telematic discount in return.
The following pages describe the 4 main applications of aviation logs more detailed seen out of the perspective of the stakeholder.